Showing posts with label Testing. Show all posts

Friday, November 11, 2011

Debugger

You can debug a valid mapping to gain troubleshooting information about data and error conditions. To debug a mapping, you configure and run the Debugger from within the Mapping Designer. The Debugger uses a session to run the mapping on the Integration Service. When you run the Debugger, it pauses at breakpoints and you can view and edit transformation output data.

You might want to run the Debugger in the following situations:

  • Before you run a session. After you save a mapping, you can run some initial tests with a debug session before you create and configure a session in the Workflow Manager.
  • After you run a session. If a session fails or if you receive unexpected results in the target, you can run the Debugger against the session. You might also want to run the Debugger against a session if you want to debug the mapping using the configured session properties.

Debugger Session Types:

You can select three different debugger session types when you configure the Debugger. The Debugger runs a workflow for each session type. You can choose from the following Debugger session types when you configure the Debugger:

  • Use an existing non-reusable session. The Debugger uses existing source, target, and session configuration properties. When you run the Debugger, the Integration Service runs the non-reusable session and the existing workflow. The Debugger does not suspend on error.
  • Use an existing reusable session. The Debugger uses existing source, target, and session configuration properties. When you run the Debugger, the Integration Service runs a debug instance of the reusable session And creates and runs a debug workflow for the session.
  • Create a debug session instance. You can configure source, target, and session configuration properties through the Debugger Wizard. When you run the Debugger, the Integration Service runs a debug instance of the debug workflow and creates and runs a debug workflow for the session.


Debug Process

To debug a mapping, complete the following steps:

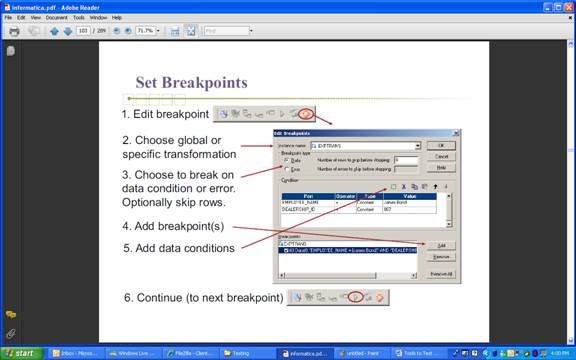
1. Create breakpoints. Create breakpoints in a mapping where you want the Integration Service to evaluate data and error conditions.

2. Configure the Debugger. Use the Debugger Wizard to configure the Debugger for the mapping. Select the session type the Integration Service uses when it runs the Debugger. When you create a debug session, you configure a subset of session properties within the Debugger Wizard, such as source and target location. You can also choose to load or discard target data.

3. Run the Debugger. Run the Debugger from within the Mapping Designer. When you run the Debugger, the Designer connects to the Integration Service. The Integration Service initializes the Debugger and runs the debugging session and workflow. The Integration Service reads the breakpoints and pauses the Debugger

when the breakpoints evaluate to true.

4. Monitor the Debugger. While you run the Debugger, you can monitor the target data, transformation and mapplet output data, the debug log, and the session log. When you run the Debugger, the Designer displays the following windows:

  • Debug log. View messages from the Debugger.
  • Target window. View target data.
  • Instance window. View transformation data.


5. Modify data and breakpoints. When the Debugger pauses, you can modify data and see the effect on transformations, mapplets, and targets as the data moves through the pipeline. You can also modify breakpoint information.

The Designer saves mapping breakpoint and Debugger information in the workspace files. You can copy breakpoint information and the Debugger configuration to another mapping. If you want to run the Debugger from another Power Center Client machine, you can copy the breakpoint information and the Debugger configuration to the other Power Center Client machine.

Running the Debugger:

When you complete the Debugger Wizard, the Integration Service starts the session and initializes the Debugger. After initialization, the Debugger moves in and out of running and paused states based on breakpoints and commands that you issue from the Mapping Designer. The Debugger can be in one of the following states:

  • Initializing. The Designer connects to the Integration Service.
  • Running. The Integration Service processes the data.
  • Paused. The Integration Service encounters a break and pauses the Debugger.

Note: To enable multiple users to debug the same mapping at the same time, each user must configure different port numbers in the Tools > Options > Debug tab.

The Debugger does not use the high availability functionality.


Monitoring the Debugger :

When you run the Debugger, you can monitor the following information:

  • Session status. Monitor the status of the session.
  • Data movement. Monitor data as it moves through transformations.
  • Breakpoints. Monitor data that meets breakpoint conditions.
  • Target data. Monitor target data on a row-by-row basis.

The Mapping Designer displays windows and debug indicators that help you monitor the session:

  • Debug indicators. Debug indicators on transformations help you follow breakpoints and data flow.
  • Instance window. When the Debugger pauses, you can view transformation data and row information in the Instance window.
  • Target window. View target data for each target in the mapping.
  • Output window. The Integration Service writes messages to the following tabs in the Output window:
  • Debugger tab. The debug log displays in the Debugger tab.
  • Session Log tab. The session log displays in the Session Log tab.
  • Notifications tab. Displays messages from the Repository Service.

While you monitor the Debugger, you might want to change the transformation output data to see the effect on subsequent transformations or targets in the data flow. You might also want to edit or add more breakpoint information to monitor the session more closely.

Restrictions

You cannot change data for the following output ports:

  • Normalizer transformation. Generated Keys and Generated Column ID ports.
  • Rank transformation. RANKINDEX port.
  • Router transformation. All output ports.
  • Sequence Generator transformation. CURRVAL and NEXTVAL ports.
  • Lookup transformation. NewLookupRow port for a Lookup transformation configured to use a dynamic cache.
  • Custom transformation. Ports in output groups other than the current output group.
  • Java transformation. Ports in output groups other than the current output group.

Additionally, you cannot change data associated with the following:

  • Mapplets that are not selected for debugging
  • Input or input/output ports
  • Output ports when the Debugger pauses on an error breakpoint

Target Load Order

Target Load Plan

When you use a mapplet in a mapping, the Mapping Designer lets you set the target load plan for sources within the mapplet.

Setting the Target Load Order

You can configure the target load order for a mapping containing any type of target definition. In the Designer, you can set the order in which the Integration Service sends rows to targets in different target load order groups in a mapping. A target load order group is the collection of source qualifiers, transformations, and targets linked together in a mapping. You can set the target load order if you want to maintain referential integrity when inserting, deleting, or updating tables that have the primary key and foreign key constraints.

The Integration Service reads sources in a target load order group concurrently, and it processes target load order groups sequentially.

To specify the order in which the Integration Service sends data to targets, create one source qualifier for each target within a mapping. To set the target load order, you then determine in which order the Integration Service reads each source in the mapping.

The following figure shows two target load order groups in one mapping:


In this mapping, the first target load order group includes ITEMS, SQ_ITEMS, and T_ITEMS. The second target load order group includes all other objects in the mapping, including the TOTAL_ORDERS target. The Integration Service processes the first target load order group, and then the second target load order group.

When it processes the second target load order group, it reads data from both sources at the same time.

To set the target load order:

  1. Create a mapping that contains multiple target load order groups.
  2. Click Mappings > Target Load Plan.
  3. The Target Load Plan dialog box lists all Source Qualifier transformations in the mapping and the targets that receive data from each source qualifier.
  4. Select a source qualifier from the list.
  5. Click the Up and Down buttons to move the source qualifier within the load order.
  6. Repeat steps 3 to 4 for other source qualifiers you want to reorder. Click OK

Constraint-Based Loading

In the Workflow Manager, you can specify constraint-based loading for a session. When you select this option, the Integration Service orders the target load on a row-by-row basis. For every row generated by an active source, the Integration Service loads the corresponding transformed row first to the primary key table, then to any foreign key tables. Constraint-based loading depends on the following requirements:

  • Active source. Related target tables must have the same active source.
  • Key relationships. Target tables must have key relationships.
  • Target connection groups. Targets must be in one target connection group.
  • Treat rows as insert. Use this option when you insert into the target. You cannot use updates with constraint based loading.

Active Source:

When target tables receive rows from different active sources, the Integration Service reverts to normal loading for those tables, but loads all other targets in the session using constraint-based loading when possible. For example, a mapping contains three distinct pipelines. The first two contain a source, source qualifier, and target. Since these two targets receive data from different active sources, the Integration Service reverts to normal loading for both targets. The third pipeline contains a source, Normalizer, and two targets. Since these two targets share a single active source (the Normalizer), the Integration Service performs constraint-based loading: loading the primary key table first, then the foreign key table.

Key Relationships:

When target tables have no key relationships, the Integration Service does not perform constraint-based loading.

Similarly, when target tables have circular key relationships, the Integration Service reverts to a normal load. For example, you have one target containing a primary key and a foreign key related to the primary key in a second target. The second target also contains a foreign key that references the primary key in the first target. The Integration Service cannot enforce constraint-based loading for these tables. It reverts to a normal load.

Target Connection Groups:

The Integration Service enforces constraint-based loading for targets in the same target connection group. If you want to specify constraint-based loading for multiple targets that receive data from the same active source, you must verify the tables are in the same target connection group. If the tables with the primary key-foreign key relationship are in different target connection groups, the Integration Service cannot enforce constraint-based loading when you run the workflow. To verify that all targets are in the same target connection group, complete the following tasks:

  • Verify all targets are in the same target load order group and receive data from the same active source.
  • Use the default partition properties and do not add partitions or partition points.
  • Define the same target type for all targets in the session properties.
  • Define the same database connection name for all targets in the session properties.
  • Choose normal mode for the target load type for all targets in the session properties.

Treat Rows as Insert:

Use constraint-based loading when the session option Treat Source Rows As is set to insert. You might get inconsistent data if you select a different Treat Source Rows As option and you configure the session for constraint-based loading.

When the mapping contains Update Strategy transformations and you need to load data to a primary key table first, split the mapping using one of the following options:

  • Load primary key table in one mapping and dependent tables in another mapping. Use constraint-based loading to load the primary table.
  • Perform inserts in one mapping and updates in another mapping.

Constraint-based loading does not affect the target load ordering of the mapping. Target load ordering defines the order the Integration Service reads the sources in each target load order group in the mapping. A target load order group is a collection of source qualifiers, transformations, and targets linked together in a mapping. Constraint based loading establishes the order in which the Integration Service loads individual targets within a set of targets receiving data from a single source qualifier.

Example

The following mapping is configured to perform constraint-based loading:


In the first pipeline, target T_1 has a primary key, T_2 and T_3 contain foreign keys referencing the T1 primary key. T_3 has a primary key that T_4 references as a foreign key.

Since these tables receive records from a single active source, SQ_A, the Integration Service loads rows to the target in the following order:

1. T_1

2. T_2 and T_3 (in no particular order)

3. T_4

The Integration Service loads T_1 first because it has no foreign key dependencies and contains a primary key referenced by T_2 and T_3. The Integration Service then loads T_2 and T_3, but since T_2 and T_3 have no dependencies, they are not loaded in any particular order. The Integration Service loads T_4 last, because it has a foreign key that references a primary key in T_3.After loading the first set of targets, the Integration Service begins reading source B. If there are no key relationships between T_5 and T_6, the Integration Service reverts to a normal load for both targets.

If T_6 has a foreign key that references a primary key in T_5, since T_5 and T_6 receive data from a single active source, the Aggregator AGGTRANS, the Integration Service loads rows to the tables in the following order:

  • T_5
  • T_6

T_1, T_2, T_3, and T_4 are in one target connection group if you use the same database connection for each target, and you use the default partition properties. T_5 and T_6 are in another target connection group together if you use the same database connection for each target and you use the default partition properties. The Integration Service includes T_5 and T_6 in a different target connection group because they are in a different target load order group from the first four targets.

Enabling Constraint-Based Loading:

When you enable constraint-based loading, the Integration Service orders the target load on a row-by-row basis. To enable constraint-based loading:

  1. In the General Options settings of the Properties tab, choose Insert for the Treat Source Rows As property.
  2. Click the Config Object tab. In the Advanced settings, select Constraint Based Load Ordering.
  3. Click OK.

Informatica Power Center Testing

Debugger: Very useful tool for debugging a valid mapping to gain troubleshooting information about data and error conditions. Refer Informatica documentation to know more about debugger tool.

Test Load Options – Relational Targets.

Running the Integration Service in Safe Mode

  • Test a development environment. Run the Integration Service in safe mode to test a development environment before migrating to production
  • Troubleshoot the Integration Service. Configure the Integration Service to fail over in safe mode and troubleshoot errors when you migrate or test a production environment configured for high availability. After the Integration Service fails over in safe mode, you can correct the error that caused the Integration Service to fail over.

Syntax Testing: Test your customized queries using your source qualifier before executing the session. Performance Testing for identifying the following bottlenecks:

  • Target
  • Source
  • Mapping
  • Session
  • System

Use the following methods to identify performance bottlenecks:

  • Run test sessions. You can configure a test session to read from a flat file source or to write to a flat file target to identify source and target bottlenecks.
  • Analyze performance details. Analyze performance details, such as performance counters, to determine where session performance decreases.
  • Analyze thread statistics. Analyze thread statistics to determine the optimal number of partition points.
  • Monitor system performance. You can use system monitoring tools to view the percentage of CPU use, I/O waits, and paging to identify system bottlenecks. You can also use the Workflow Monitor to view system resource usage. Use Power Center conditional filter in the Source Qualifier to improve performance.
  • Share metadata. You can share metadata with a third party. For example, you want to send a mapping to someone else for testing or analysis, but you do not want to disclose repository connection information for security reasons. You can export the mapping to an XML file and edit the repository connection information before sending the XML file. The third party can import the mapping from the XML file and analyze the metadata.

User Acceptance Test

In this phase you will involve the user to test the end results and ensure that business is satisfied with the quality of the data.

Any changes to the business requirement will follow the change management process and eventually those changes have to follow the SDLC process.

Optimize Development, Testing, and Training Systems

  • Dramatically accelerate development and test cycles and reduce storage costs by creating fully functional, smaller targeted data subsets for development, testing, and training systems, while maintaining full data integrity.
  • Quickly build and update nonproduction systems with a small subset of production data and replicate current subsets of nonproduction copies faster.
  • Simplify test data management and shrink the footprint of nonproduction systems to significantly reduce IT infrastructure and maintenance costs.
  • Reduce application and upgrade deployment risks by properly testing configuration updates with up-to-date, realistic data before introducing them into production .
  • Easily customize provisioning rules to meet each organization’s changing business requirements.
  • Lower training costs by standardizing on one approach and one infrastructure.
  • Train employees effectively using reliable, production-like data in training systems.

Support Corporate Divestitures and Reorganizations

  • Untangle complex operational systems and separate data along business lines to quickly build the divested organization’s system.
  • Accelerate the provisioning of new systems by using only data that’s relevant to the divested organization.
  • Decrease the cost and time of data divestiture with no reimplementation costs .

Reduce the Total Cost of Storage Ownership

  • Dramatically increase an IT team’s productivity by reusing a comprehensive list of data objects for data selection and updating processes across multiple projects, instead of coding by hand—which is expensive, resource intensive, and time consuming .
  • Accelerate application delivery by decreasing R&D cycle time and streamlining test data management.
  • Improve the reliability of application delivery by ensuring IT teams have ready access to updated quality production data.
  • Lower administration costs by centrally managing data growth solutions across all packaged and custom applications.
  • Substantially accelerate time to value for subsets of packaged applications.
  • Decrease maintenance costs by eliminating custom code and scripting.
Related Posts Plugin for WordPress, Blogger...